https://www.optimadesign.ch/assets/images/common/Data-Visualisation-mobile.jpg

Data Visualisation Visualising data for engagement and understanding

Transforming complex data into meaningful visual insights for greater impact.

Data, when visualized clearly, becomes a powerful tool for decision-making and storytelling. We work closely with nonprofits to turn complex marketing data into visually compelling graphs, charts, and dashboards, whether you need to track donor engagement, campaign performance, or outreach impact, our visual solutions help you understand your audience and share your story effectively. Our intuitive, easy-to-understand visualisations empower your team to make data-driven decisions, while also providing your stakeholders with a clear picture of your success. We simplify the numbers so you can focus on what really matters—making a meaningful difference in the world.

Custom solutions are tailored specifically for NGOs and nonprofits, making it easier to present complex information in a way that resonates with audiences and stakeholders. By turning raw data into meaningful visuals, not only is a deeper understanding achieved, but it also becomes possible to inspire action and amplify impact. Let’s work together to transform your data into a visual narrative to make any mission shine through effective, data-driven storytelling.
Take a look at some of our data visualisation projects:

World_Heart_Observatory_Responsive_Webste_1.jpg

World Heart Observatory

The World Heart Observatory website collects, analyzes and disseminates global data on cardiovascular health.

UNESCO

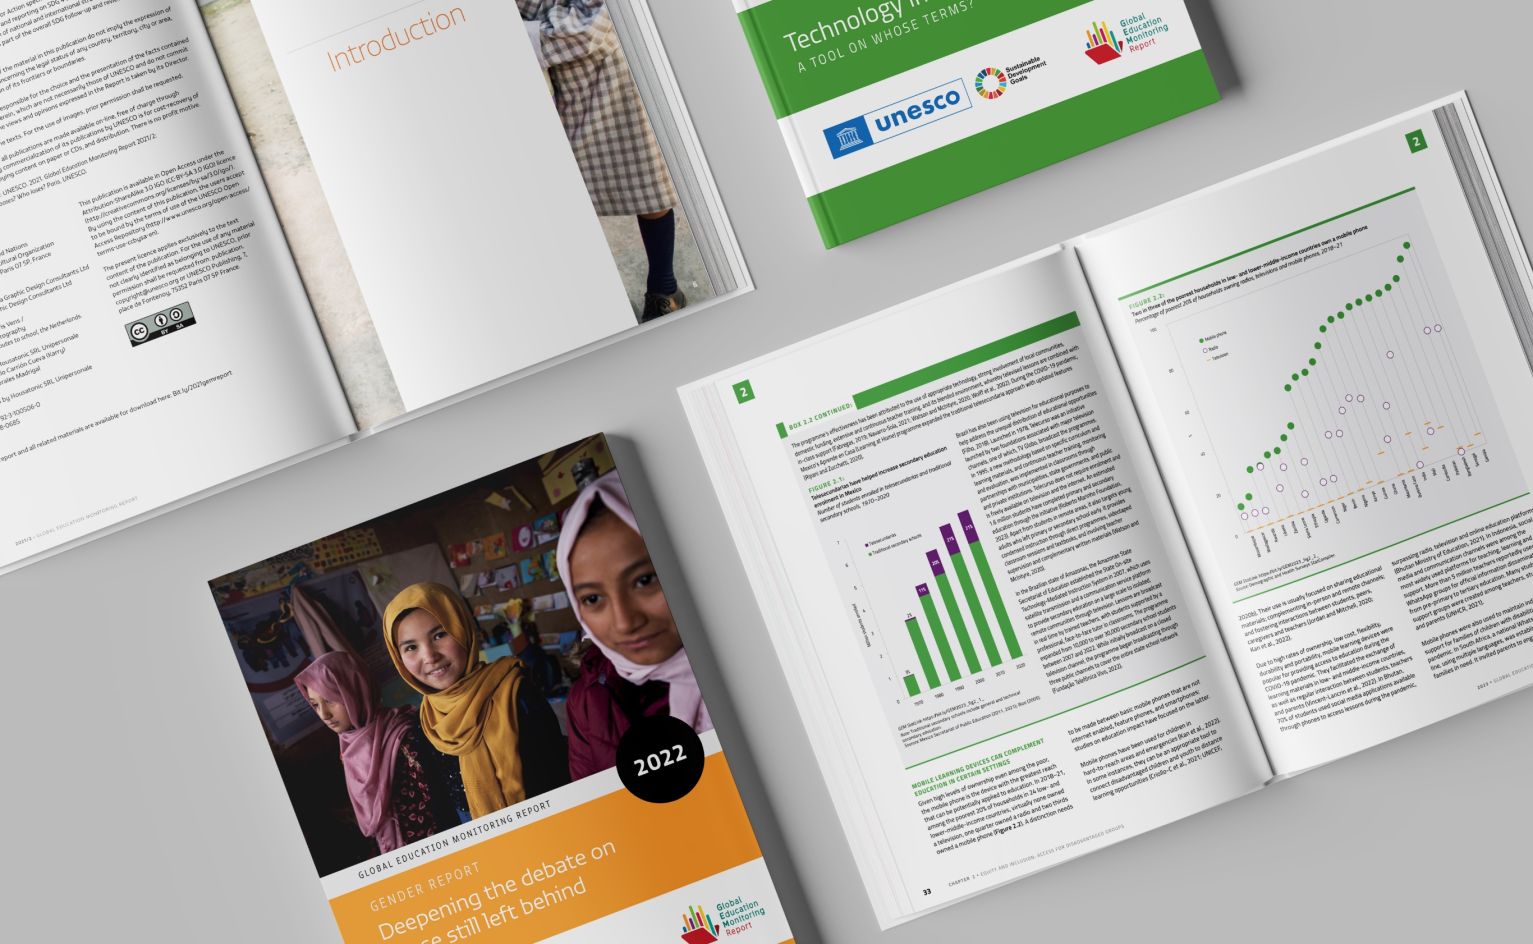
UNESCO Gem Report

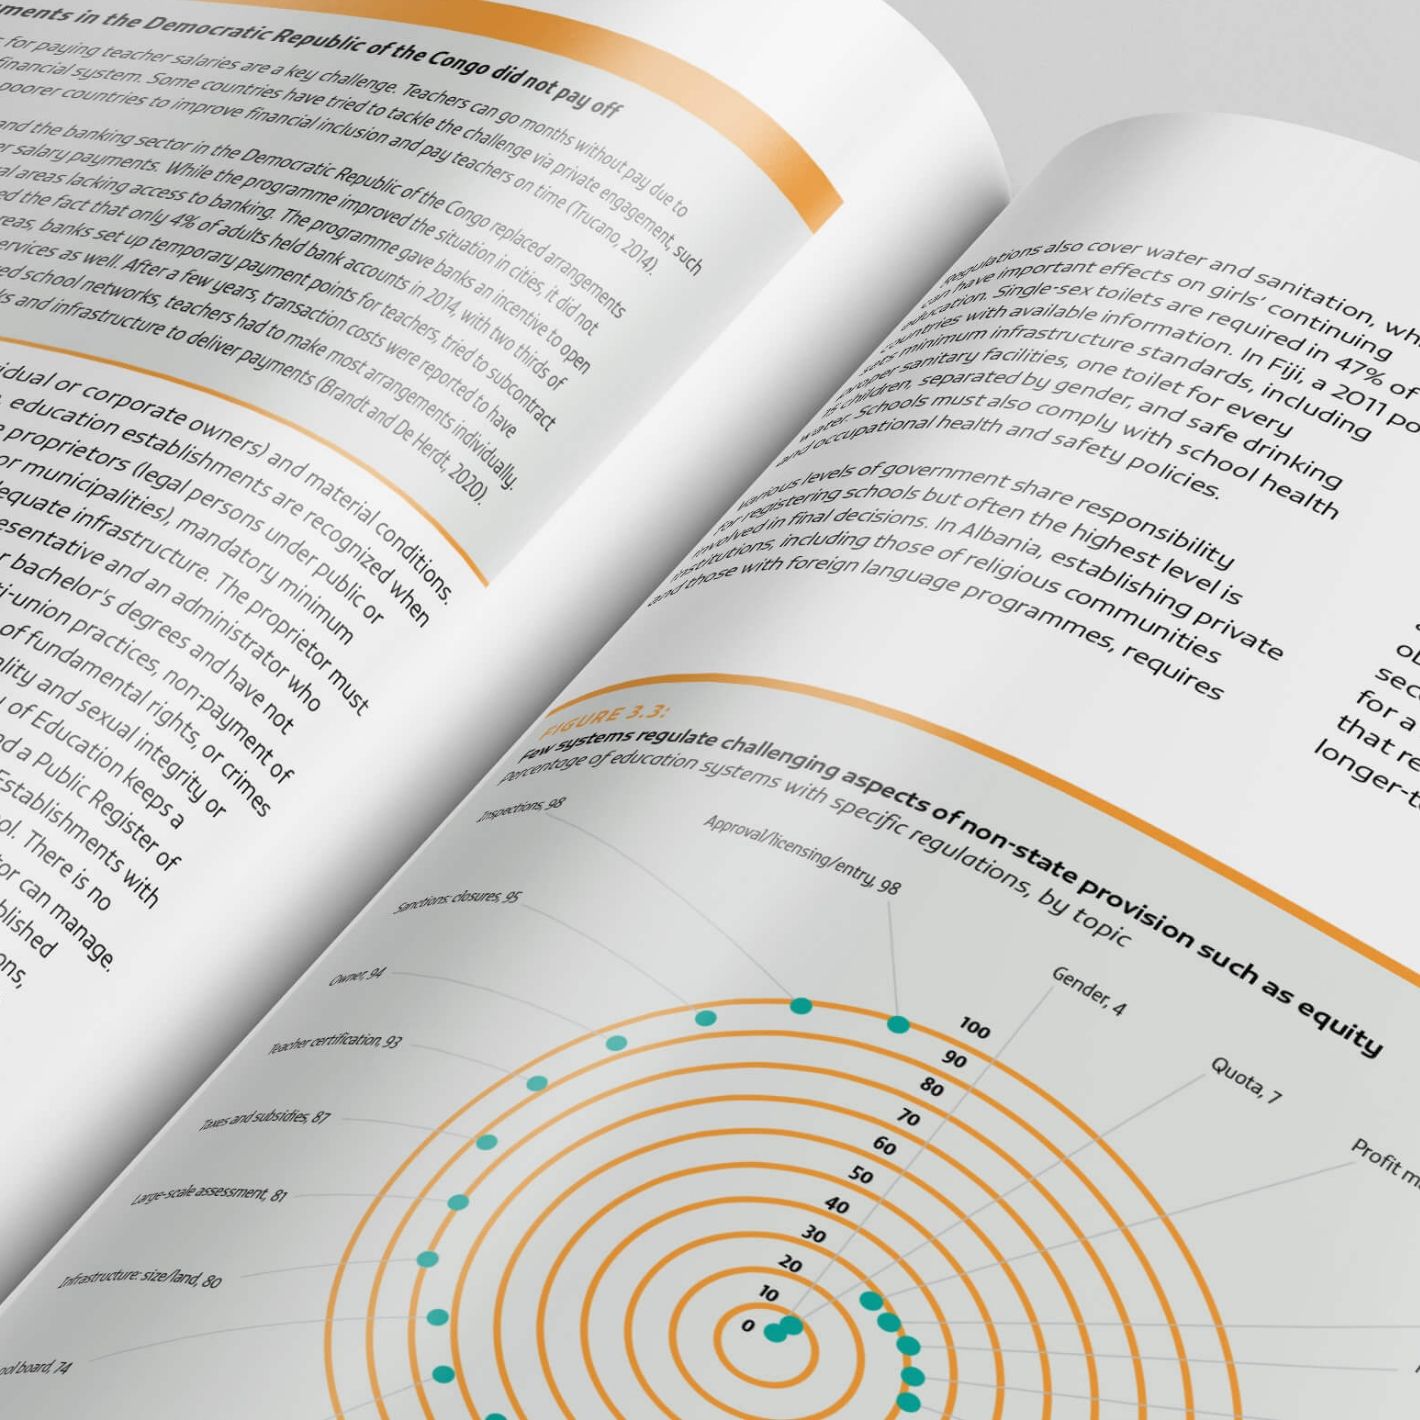
Optima partnered with UNESCO to deliver visually engaging and multilingual designs for the Global Education Monitoring (GEM) Report, a key publication tracking progress towards SDG 4.

WHF-Infographic-Square-Preview.jpg

World Heart Infographics

Optima’s work with the World Heart Federation demonstrates the power of well-designed, data-driven infographics and visual tools in the field of global health advocacy

World_Heart_Observatory_Data_Visualisation_1.jpg

World Heart Observatory

The World Heart Observatory website collects, analyzes and disseminates global data on cardiovascular health.

Uni-Global-Infographic-Close-Up-2.jpg

UNI Global Infographics

A visually engaging system of infographics that effectively communicated data on healthcare worker migration and system challenges.

NCDA-Responsive-Digital-Report_1.jpg

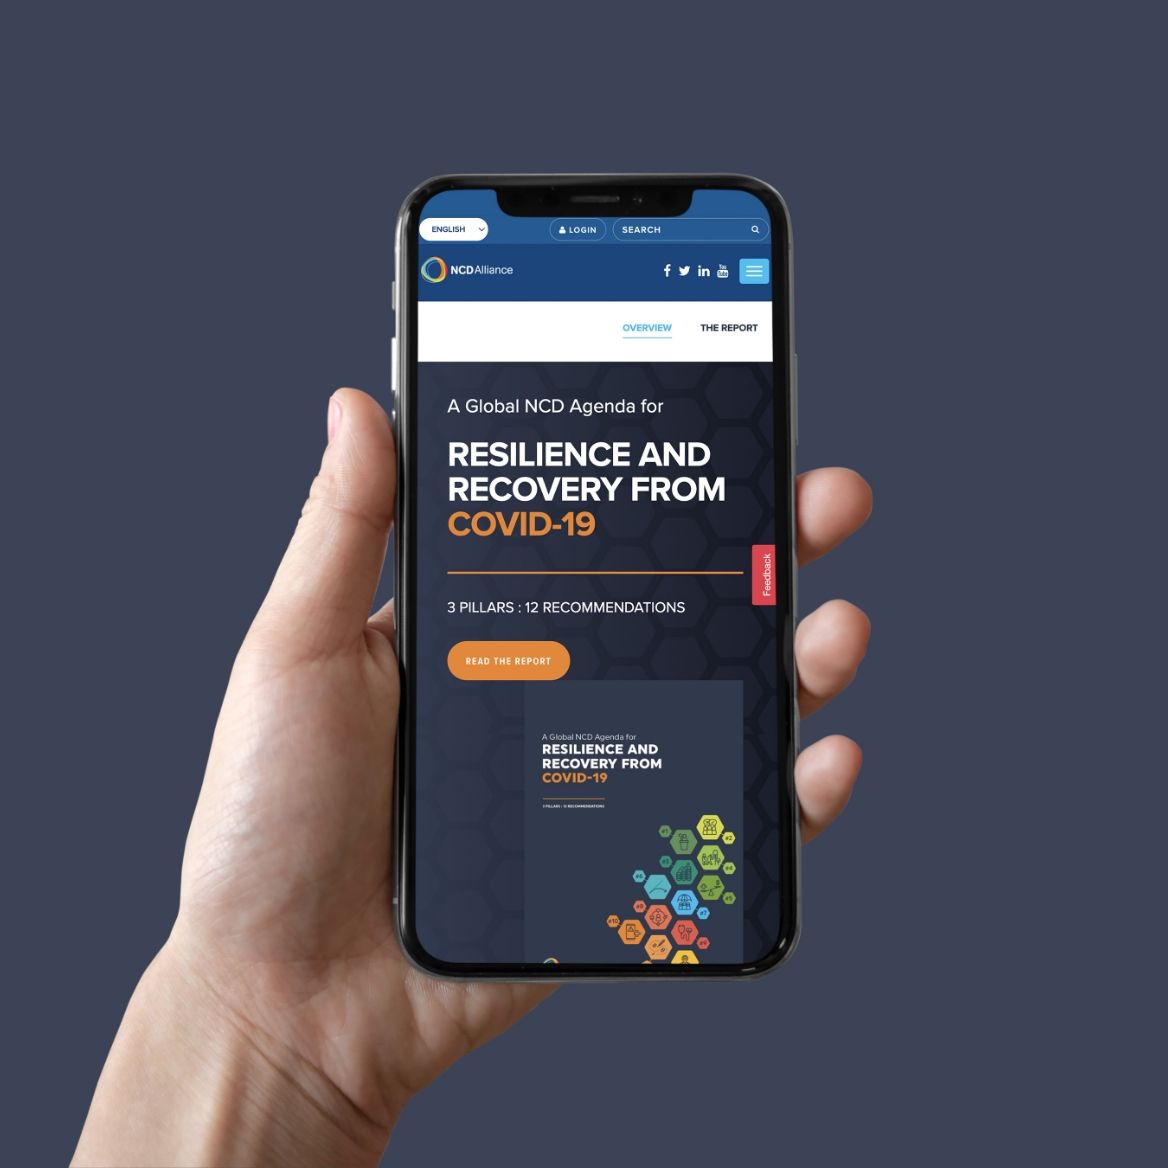
NCD Alliance Resilience & Recovery Reports

Optima helped the NCD Alliance create a dynamic Resilience & Recovery report, combining striking visual design with clear, accessible sections in print and online formats

NPA Clearing the Mines Spreads

Norwegian People’s Aid

Reporting on Global Mine and Cluster Munitions Action

Unesco_Chart_Details_1.jpg

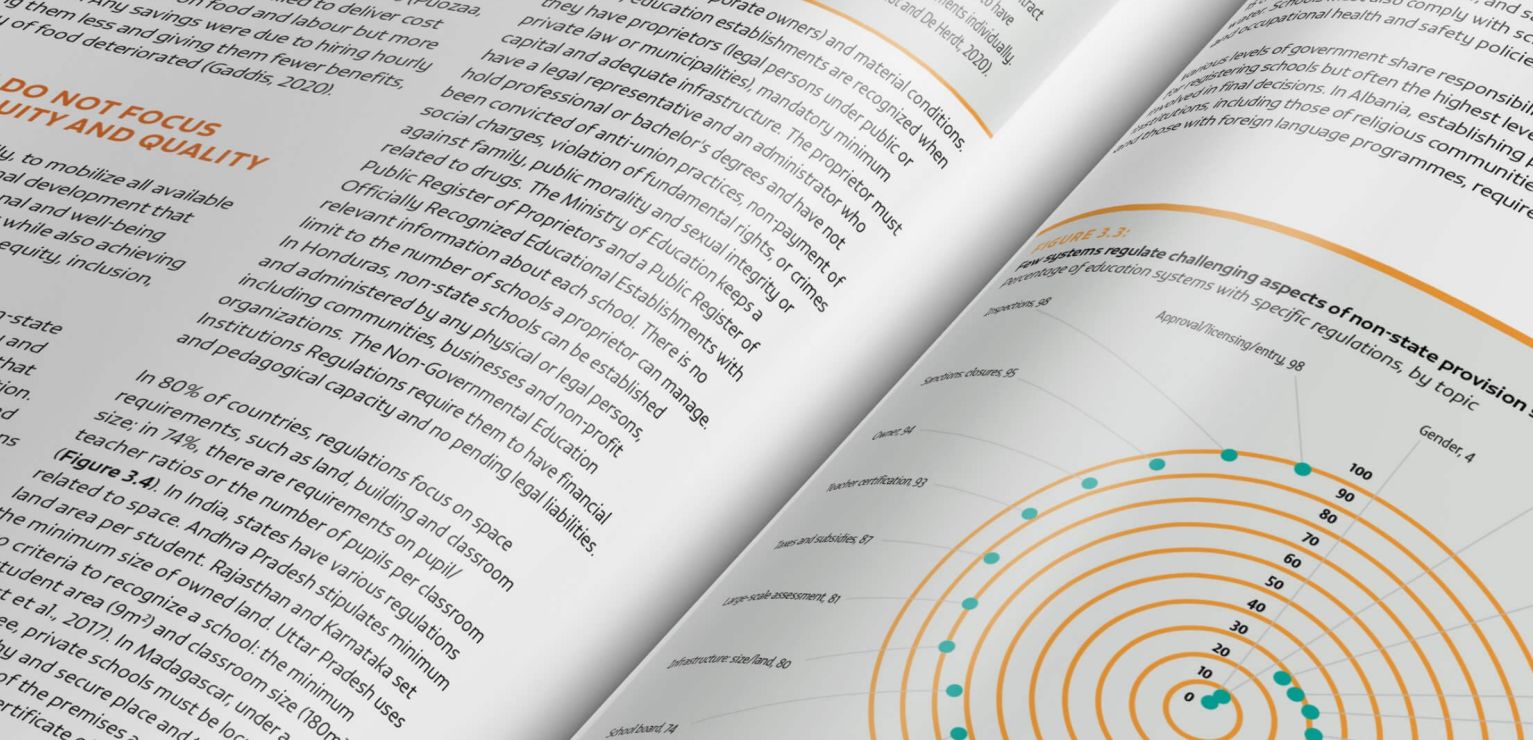
UNESCO Gem Report

Optima partnered with UNESCO to deliver visually engaging and multilingual designs for the Global Education Monitoring (GEM) Report, a key publication tracking progress towards SDG 4.

World_Heart_Observatory_Global_Data.jpg

World Heart Observatory

The World Heart Observatory website collects, analyzes and disseminates global data on cardiovascular health.

Can we help you with a data visualisation project?

GET IN TOUCH